This is the early access documentation preview for Custom Views. This documentation might not be in sync with our official documentation.
Logging
Use logs to trace requests, view metrics, and debug your application.
Logging helps developers to report information for debugging and monitoring purposes. commercetools Frontend supports logging out of the box, and you can find all the collected logs on your Humio dashboard.
In this article, you'll learn about logging and tracing requests through different extensions like a dynamic-page-handler or actions or data-sources.
Add logs to your application
commercetools Frontend follows JavaScript's default logging mechanism using the console global object.
| Method | Log level | Supported environment |
|---|---|---|
console.log | INFO | development |
console.debug | DEBUG | development |
console.info | INFO | development, staging, and production |
console.warn | WARNING | development, staging, and production |
console.error | ERROR | development, staging, and production |
import {DataSourceConfiguration,DataSourceContext,DynamicPageContext,DynamicPageRedirectResult,DynamicPageSuccessResult,ExtensionRegistry,Request,} from '@frontastic/extension-types';import { getLocale, getPath } from './utils/Request';import { ProductRouter } from './utils/ProductRouter';import { Product } from '../../types/product/Product';import { SearchRouter } from './utils/SearchRouter';import { Result } from '../../types/product/Result';import { CategoryRouter } from './utils/CategoryRouter';import { ProductApi } from './apis/ProductApi';import { ProductQueryFactory } from './utils/ProductQueryFactory';export default {'dynamic-page-handler': async (request: Request,context: DynamicPageContext): Promise<DynamicPageSuccessResult | DynamicPageRedirectResult | null> => {// dynamic page handlerreturn null;},'data-sources': {'frontastic/product-list': async (config: DataSourceConfiguration,context: DataSourceContext) => {console.log('Start of execution: frontastic/product-list'); // INFOconst productApi = new ProductApi(context.frontasticContext,context.request ? getLocale(context.request) : null);const productQuery = ProductQueryFactory.queryFromParams(context?.request,config);console.warn('Showing a warning: ', { productQuery }); // WARNINGconsole.error('Showing an error: fake error'); // ERRORreturn await productApi.query(productQuery).then((queryResult) => {return {dataSourcePayload: queryResult,};});},},actions: {// actions.....},};
View logs during development
From the CLI dashboard, you can monitor the extensions logs. Press the e key to see the execution logs of your extensions running on the extension runner. The logs include run time errors, console.log calls from the extensions during execution, information about the upload of the extension build after recompile, and information about the execution of extensions.
View logs and metrics for deployed application
To view logs and metrics of a deployed application, you need to log into your Humio account. To access your Humio dashboard, follow these steps:
- Open the Humio dashboard.
- In the Select region drop-down, select Europe, Frankfurt.
- Click Log in with GitHub and complete the authentication flow.
If you don't have a Humio account, contact Support to get access.
Once logged in, you can access your application logs in the Search area. You can use the search feature to trace a request.
You can access the Dashboard area to view the default dashboard prepared by the commercetools Frontend team. This dashboard displays performance metrics for your application. You can also add new Widgets to the default dashboard or create a new dashboard.
Trace a request from frontend to backend
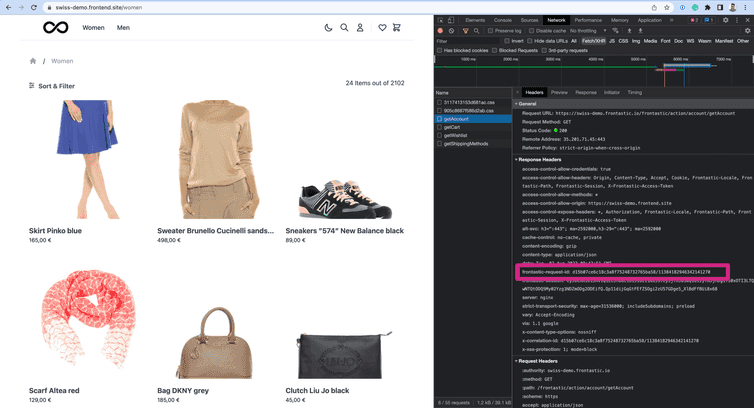
Sometimes, you may need to trace a request through different services to debug an issue. To help with this, commercetools Frontend adds the frontastic-request-id header with a unique identifier to all requests that come through the API hub.
You can copy the frontastic-request-id header value from the request headers in the Network tab of the browser developer console, as shown below.
You can use the frontastic-request-id header value to search logs in the Humio dashboard. To learn more about how you can search and filter data, see Searching data.
