This is the early access documentation preview for Custom Views. This documentation might not be in sync with our official documentation.
OpenTelemetry
Monitor and observe your SDK with OpenTelemetry.
OpenTelemetry is an observability framework and toolkit designed to create and manage telemetry data such as traces, metrics, and logs. You can use OpenTelemetry with a wide range of observability backends, including open-source tools like Jaeger and Prometheus.
Java SDK
Prerequisites
- OpenTelemetry automatic instrumentation agent configured
Include OpenTelemetry monitoring in the Java SDK
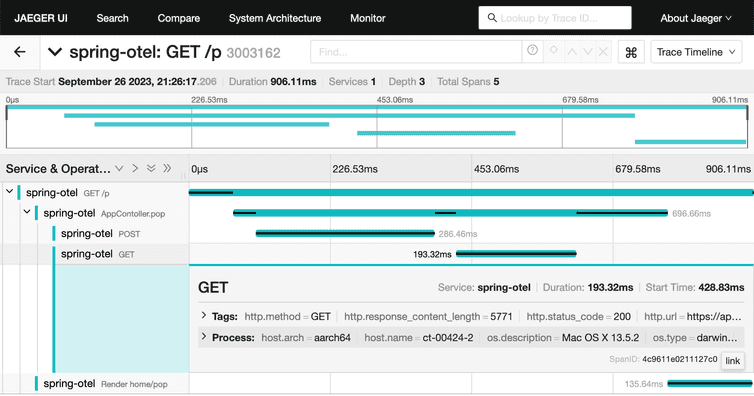
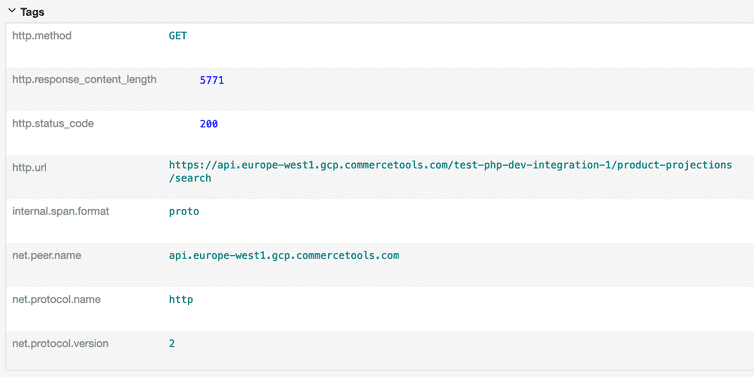
The OpenTelemetry agent supports the CompletableFutures and HTTP clients used by the Java SDK, so every API call can be traced by OpenTelemetry without extra configuration in the SDK Client.
For an example of integrating OpenTelemetry with the Java SDK, refer to the spring-otel example application.
The commercetools-monitoring-opentelemetry module includes telemetry middleware for monitoring request execution and response times, alongside counters for requests and errors. In addition, the ResponseSerializer tracks the time taken to serialize and deserialize JSON payloads.
ApiRootBuilder.of().defaultClient(credentials()).withSerializer(new OpenTelemetryResponseSerializer(ResponseSerializer.of(),GlobalOpenTelemetry.get())).withTelemetryMiddleware(new OpenTelemetryMiddleware(GlobalOpenTelemetry.get())).build(projectKey);
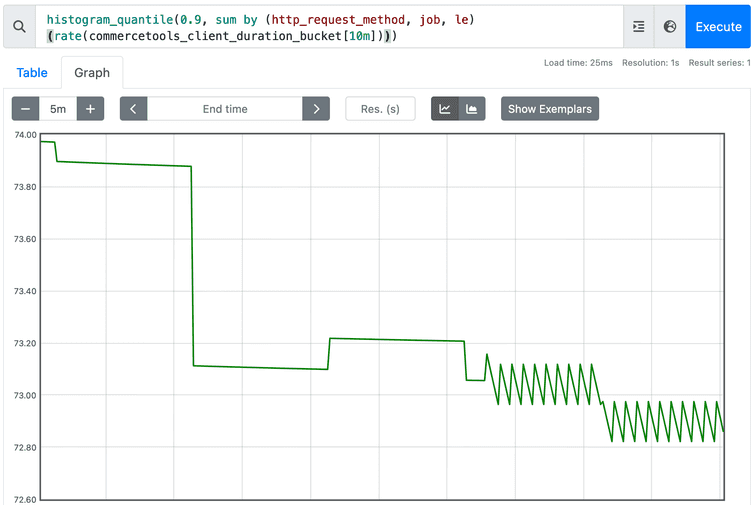
The corresponding metric would be displayed as follows in Prometheus:
.NET SDK
Prerequisites
- OpenTelemetry instrumentation agent for NuGet configured
Include OpenTelemetry monitoring in the .NET SDK
The .NET SDK is fully compatible with OpenTelemetry for tracing async methods and HTTP client communications without additional configuration.
The example Me Endpoint Checkout App is preconfigured to export traces and metrics to the command-line. Using the application config file these can be exported to an OpenTelemetry Protocol (OTLP) endpoint.
Using the OpenTelemetry collector
For testing purposes, we provide a OpenTelemetry Collector setup with Docker. It includes an OpenTelemetry collector, a Jaeger UI, Prometheus, Grafana, New Relic, Dynatrace, and Datadog as export targets. Every commercetools SDK supports the OpenTelemetry Collector.
Exporting to third-party observability tools
New Relic
To export to New Relic, do the following:
Dynatrace
To export to Dynatrace, do the following:
Datadog
To export to Datadog, do the following:
- Add
DATADOG_API_KEYto the.envfile. - Update the
DATADOG_SITEvariable if you are not using theEU1Datadog site. - Uncomment the Datadog command in the
docker-compose.ymlfile.


